- Date: 2026/04/10
- Symbol: BTC
- Interval: 4H
- Bias: Bearish
**EMA Colors:**
EMA7 (Yellow) / EMA25 (Orange) / EMA50 (Sky Blue) / EMA100 (Green) / EMA200 (Purple)
**Background Guide:**
🟢 Dark green = Strong bullish alignment (EMA7 > 25 > 50 > 100 > 200)
🟢 Light green = Bullish alignment (EMA25 > 50 > 100 > 200)
🔴 Dark red = Strong bearish alignment (EMA7 < 25 < 50 < 100 < 200)
🔴 Light red = Bearish alignment (EMA25 < 50 < 100 < 200)
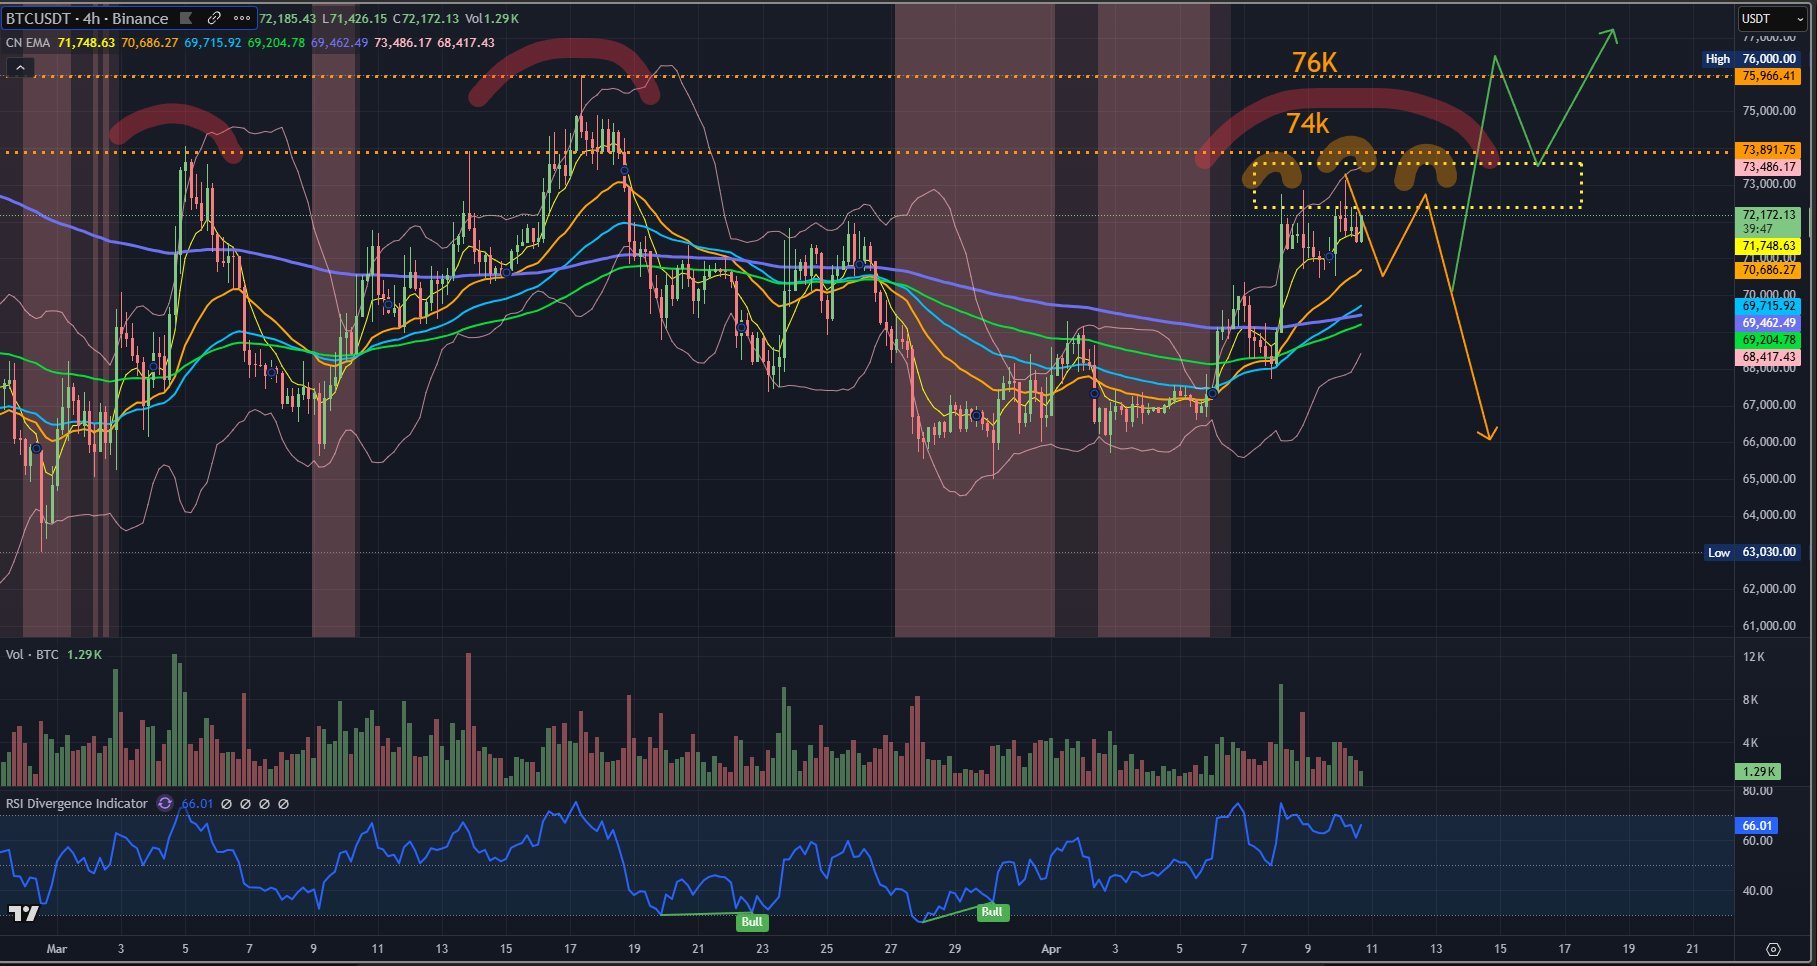
Here's my BTC chart on the 4H timeframe.
I believe we're at a critical decision point right now.
If I had to pick a side, I'm leaning slightly bearish — the orange route.
**Why I favor the bearish case:**
1. Price has already formed three small tops in the short term (triple top).
2. If price moves sideways through the weekend without a clear breakout, the right shoulder could complete — forming a short-term head and shoulders pattern : Orange arcs
3. Zooming out, the current price level closely mirrors the left shoulder zone around $74K. This adds to the possibility that we're forming the right shoulder of a larger head and shoulders : Red arcs
**The bullish case is still on the table** — the green route.
However, for the bullish scenario to play out, BTC needs to break above the previous high of $76K as quickly as possible — ideally by early next week — followed by a healthy pullback. If $76K ultimately fails to break, the bearish case gains significant weight. (Whenever price fails to take out the previous swing high/low, it's a strong signal for a potential trend reversal.)
**Additional bearish confluences from the weekly chart:**
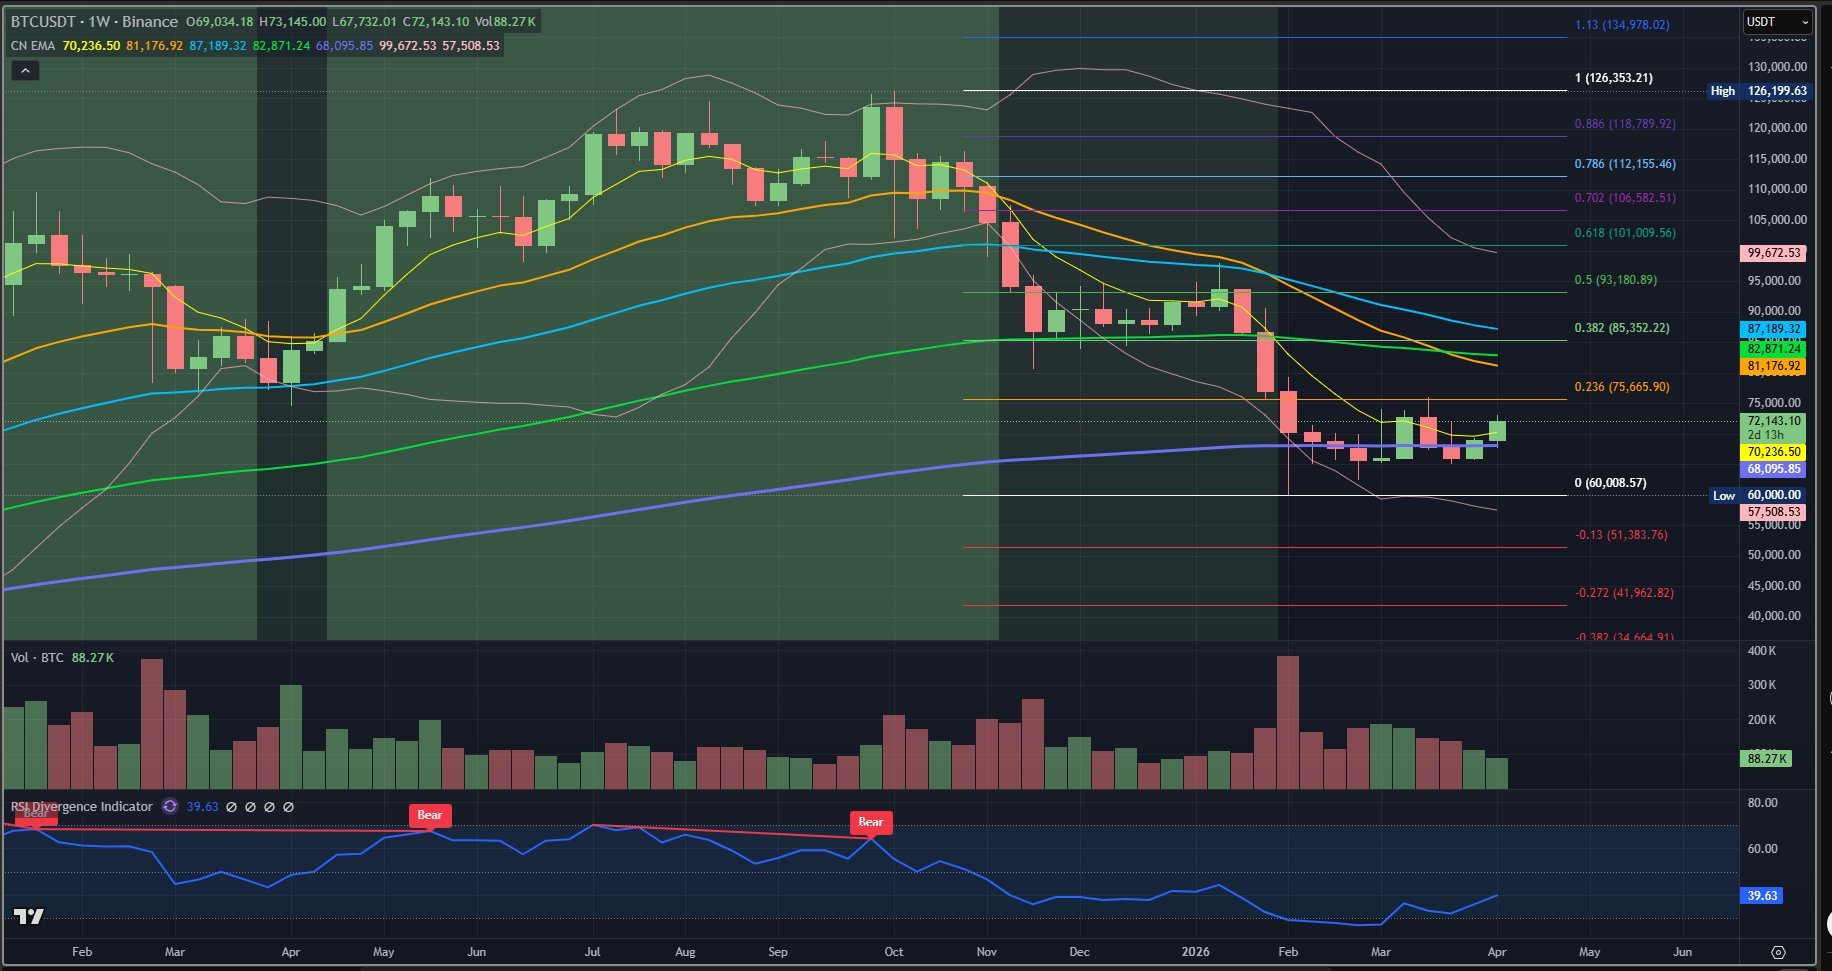
1. Price is currently sitting at the 23.6% Fibonacci retracement level of the entire decline
2. BTC has been consolidating around the EMA 200 for an extended period — chopping above and below it.
3. If $76K holds as resistance, there's a possibility of an ABCDE triangle consolidation followed by a breakdown.
4. On the weekly chart, the bullish EMA alignment has already broken down — suggesting another leg down is possible.
What's your take on this setup?
Analysis performed using the Coinugget EMA Trend indicator.
Optimized for trend strength and dynamic support/resistance identification.