Sometimes the simplest approach works best in trading.
The goal is straightforward: read the overall trend, then find a support or resistance level to enter.
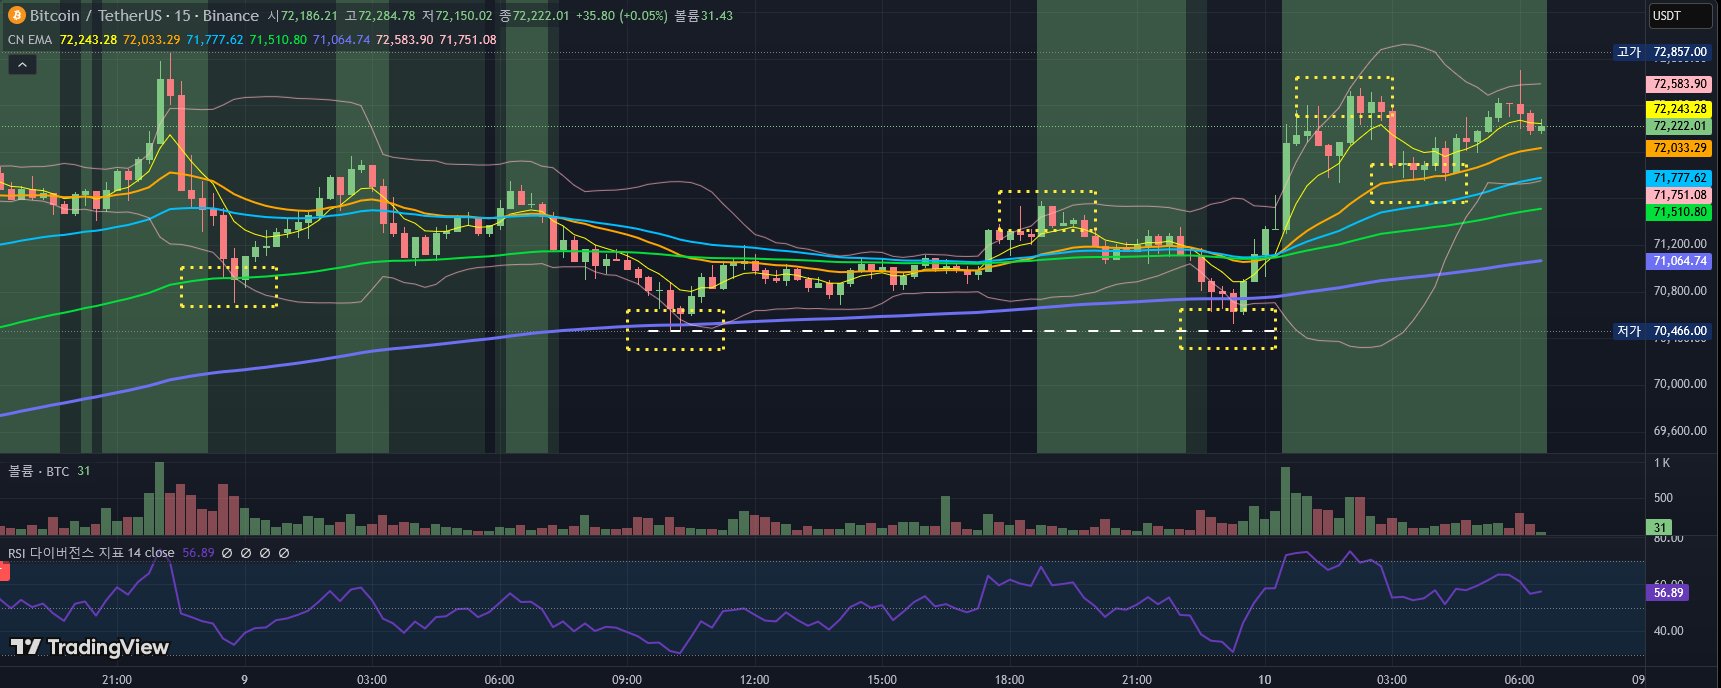
Our team primarily uses 4 EMAs to read the big picture. EMA25, 50, 100, 200 — each level acts as a dynamic support or resistance.
For short-term entries, we sometimes go against the move when price touches the BB Upper or Lower band.
And to confirm trend strength? We watch whether price respects previous highs and lows. A trend stays valid as long as it doesn't break those key levels.
And for momentum? RSI. The most widely used indicator for a reason.
EMA + BB + Previous highs/lows + RSI. We believe that's all you really need.
The indicator used here is Coinugget EMA Trend — now available publicly on TradingView.
P.S. The background color gives you a quick visual cue:
🟢 Dark green = Strong bullish alignment (EMA7 > 25 > 50 > 100 > 200)
🟢 Light green = Bullish alignment (EMA25 > 50 > 100 > 200)
🔴 Dark red = Strong bearish alignment (EMA7 < 25 < 50 < 100 < 200)
🔴 Light red = Bearish alignment (EMA25 < 50 < 100 < 200)